We are still currently evaluating Golioth for our project and have around 20 units based on ESP32’s running the latest IDF currently deployed. We have done 3 firmware updates this month testing the reliability of it (much more than we would do normally) and they have been mostly smooth but we notice in our account the OTA usage seems very high. The firmware packages are all under 800KB but each update we issue seems to consume between 500-600MB on the usage chart and I am not sure how. With the pricing per MB it makes each unit receiving an OTA around $8.75 which seems very high.
When adding up the usage of our SIM cards this month we only have 400MB up and down actually transmitted over the network. Which does seem high and we would expect to be lower as we are sending COAP payloads of 36 bytes every 5 mins.
I just wondered if I was missing something or if you had any pointers on what we can look at to get to the bottom of it?
Hi Sam - thanks for reporting this issue. Just a quick note to let you know that we’re doing some digging on our end and will likely have some additional questions for you shortly, stay tuned!
Hello again Sam - are you aware of excessive retries on your OTA updates? Golioth measures OTA usage at the device service, so technically there could be a scenario in which an OTA is triggered but does not fully complete, then is retried. Each of those retry events would be recorded as usage by the Golioth service.
We took a look at your project and it appears that devices are repeatedly fetching OTA artifacts when updating (i.e. on the order of 30s between requests). Each OTA matches the size of the artifacts that you mentioned, which makes us think that the usage is being accurately recorded, but the issue here is the retries.
Thank you for your reply. So just to confirm if a device starts downloading an OTA and whilst downloading the blocks (it seems to fetch 1kb at a time) if it is interrupted the entire artifact would be counted as OTA bandwidth even if its not actually used?
As our devices are connecting over 2G in a congested area with around a 10% BER we are aware there are often TLS negotiation errors when fetching data. We also seem to often experience requests downloading 0 bytes and coap returning error code 15 which I believe is bad request on the first byte which after a few attempts will trigger a full modem restart. Would it mean that for all those retries where we use almost no bytes we are actually billed at the full 800kb? That would explain the higher usage but is not ideal.
As we have only used 400MB on the SIM cards according to the network I find it unlikely that we can have actually downloaded that many bytes even if we for some reason have to retry a download.
Hi,
I discovered the same issue and tried to investigate it a little. I compiled the “fw_update” example for an ESP32-S3, which resulted in a BINfile with 889kb size.
As I haven’t used my golioth account in june i started with montly usage of 0 byte.
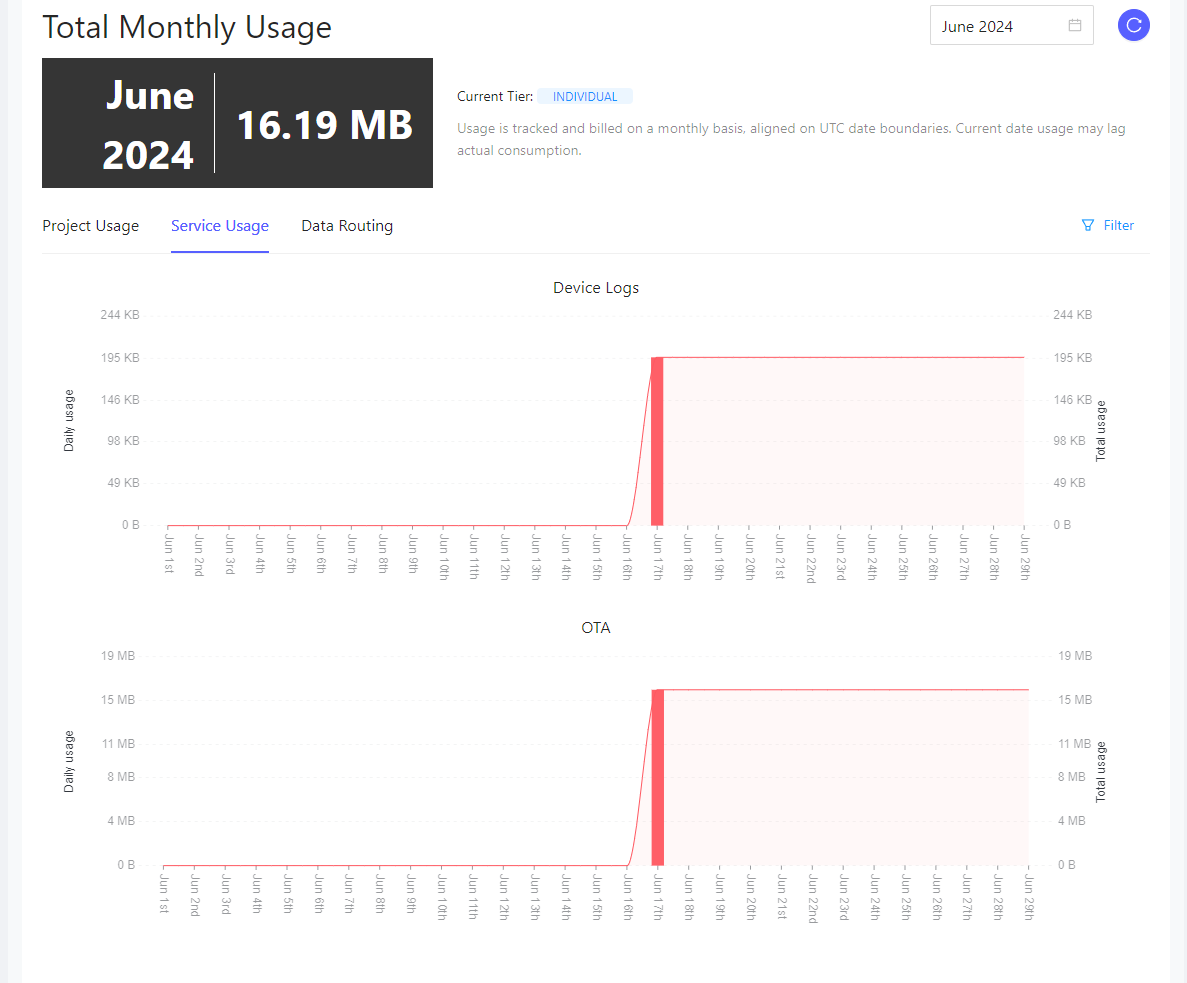
After flashing the mentioned firmware and letting the ESP sitting for a while, it had consumed 7kb of “device log” traffic. I updated the FW version, recompiled it and initiated the OTA process with the 889kb BIN file.
The FW was split into 889 chunks and the OTA process was performed without any retransmission or other problems
After the OTA was finished, I checked the golioth usage page and round about 16MB were consumed for this single update:
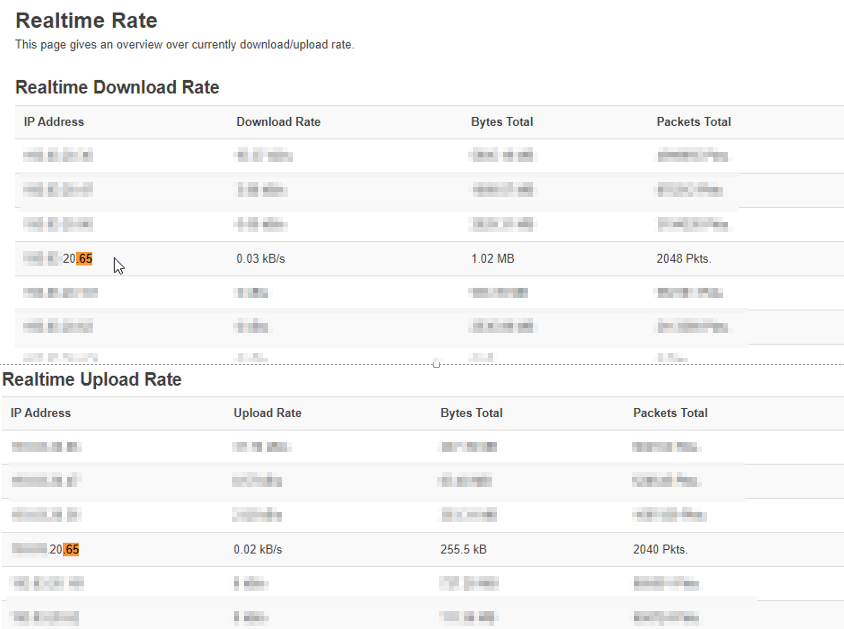
I double-checked the wifi-traffic of the ESP on my wifi-router, which logged 1.02MB down- and 255KB upload, which makes sense in respect to the binary file size. (I can only upload one picture per entry, so will post them separately.)
I hope this information is helpful.
Thanks,
Philipp
Thank you both for this useful feedback! The discrepancies you’re seeing are a result of the mechanism we currently utilize to measure OTA usage. Usage is expected to be accrued if an OTA update is successfully delivered to a device, and usage greater than the size of the single artifact may be accrued if the device subsequently downloads the artifact again. However, usage equivalent to the full size of the artifact should not be accrued in the event that the entire artifact is not delivered due to issues on the device or intermediate network hops.
We are taking steps to ensure that a more precise usage measurement is employed in these scenarios. We are also able to review raw (non-aggregated) usage metrics for a given billing period and ensure that the the usage reflected in an invoice accurately represents a customer’s consumption for that period.
I think I have some more details on the retrying issue we seem to have. I have not yet had time to get it into a minimal example so I will just explain my experiences. To test OTA updates we create an artifact for a blueprint with a version number for example 0.0.9. We also make an artifact without a blueprint for all devices. Roll out the blueprint version first and if we are happy we then rollout the main version. When we do this it seems to fail downloading for any devices which have both valid updates and we see log lines such as:
I (588876) golioth_fw_update: Received OTA manifest
I (588876) golioth_fw_update: Current version = 0.0.8, Target version = 0.0.9
I (588876) golioth_fw_update: State = Downloading
I (590056) golioth_fw_update: Image size = 754384
I (590066) fw_block_processor: Downloading block index 0 (1/737)
W (590956) golioth_coap_client_libcoap: 5.00 (req type: 2, path: .u/c/[email protected]), len 0
W (590966) fw_block_processor: Failed to get block, will retry. Status: 15
W (591496) golioth_coap_client_libcoap: 5.00 (req type: 2, path: .u/c/[email protected]), len 0
W (591506) fw_block_processor: Failed to get block, will retry. Status: 15
W (591996) golioth_coap_client_libcoap: 5.00 (req type: 2, path: .u/c/[email protected]), len 0
When I get some time I plan to dig deeper into exactly what’s happening with the updates.
I also am slightly confused by the examples provided and OTA rollbacks. We have tested an OTA which caused a stack overflow before it could connect to Golioth but it never rolled back. We noticed that in the fw_update_thread it will wait 60 seconds golioth-firmware-sdk/src/fw_update.c at main · golioth/golioth-firmware-sdk · GitHub. We would absolutely need this to be configurable as some devices take longer to connect to the network that 60 seconds. In all the examples though it only has the thread started after the blocking network connection: golioth-firmware-sdk/examples/esp_idf/fw_update/main/app_main.c at main · golioth/golioth-firmware-sdk · GitHub. This is also the case in the reference device code I looked at which often indefinitely blocked before starting the client and OTA thread. This means if there are any issues with the device connecting because of an OTA or a problem elsewhere such as a panic/crash/brownout it will never rollback the OTA leaving the device permanently offline. I feel like this must be handled properly somewhere so let me know if I have just missed an example.
Just to clarify we are aware blueprints are not the correct way to separate devices: How can I deploy updates to different blueprints from the same image We do have different hardware for dev devices to live so should probably never have an OTA which does not specify the blueprint.
We did this because we experienced issues with updates not being received by devices but recently found that this was the start rollout button. If we had an OTA which immediately started the rollout it would not be picked up by devices but if we started it paused and used the toggle button it would updated devices right away. Not sure if this is something our end or yours.
My apologies I believe I completely missed the CONFIG_BOOTLOADER_APP_ROLLBACK_ENABLE esp-idf option which will rollback on panics etc without the image being marked as valid. We already have our own timeouts on connection which will cause a reset. It is mention in your examples I must have missed it earlier.
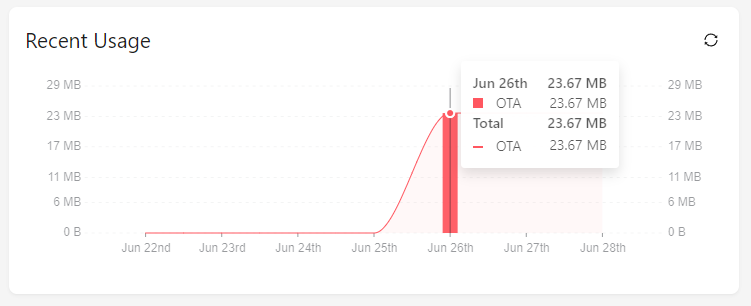
I am seeing similarly high OTA update numbers. I am in the process of migrating to the new SDK and during initial debug testing my device did four partial downloads (one full and three that downloaded less than 25%) of a 1.2MB firmware image which should be less than 1.21 * 4 = 4.84MB, but the reported usage is just under 24 MB. My firewall reports just under 2 MB which fits what I would expect.
Regardless of what the device is doing, there needs to be some server-side settings to disable repeated downloads if a device is having issues to avoid excessive bandwidth usage. Ideally the SDK should at least allow resuming a download instead of restarting the entire download. The protocol is block based, so in theory it is a trivial block hash approach, but I understand that requires a bit more effort on the SDK and server side since it requires a block-hash and block-request API.
Thanks all for the continuing feedback and questions about OTA usage monitoring in the web console and related billing concerns.
Currently the console can display OTA metrics that exceed actual usage, especially in the case of retries. This data is normalized at the end of a billing period, so it will not impact the amount you are charged. However, we recognize the importance of being able to accurately gauge your usage within a given billing period and will be rolling out an update to bring the console OTA metrics in line with those used for billing. Our apologies for the confusion here, and please do reach out if you have further questions!
Currently the console can display OTA metrics that exceed actual usage, especially in the case of retries.
You may want to get your developers to take another look at the logs as in all honesty, the download metrics are just plain wrong and are inflated by over 10x the actual bandwidth usage and over 15x the firmware file size.
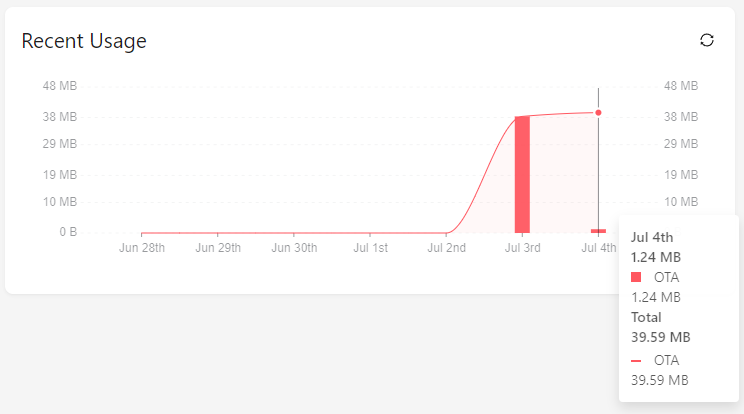
For example, I just tested a firmware download with no retries. The firmware is 1.34MB in size. My firewall reported total download of 1.97MB, but the Golioth OTA usage for the device shows 20.94MB.
Thanks for the added feedback Eric. We’re tracking the issue you’re referencing, have isolated the issue and are actively testing a solution. We’ll make sure that you’re in the know as soon as we ship the fix!
Hey folks, really appreciate all the feedback and sharing of data here. We deployed an update to the OTA usage shown in the console today. You should now see accurate metrics that mirror those we use for usage at the end of a billing period. As mentioned, the previous metrics could exceed the actual total usage as they were rough aggregations based on OTA update requests and the size of the requested artifact. These did not impact the amount customers were billed, but they created a confusing UX and were unhelpful in estimating actual OTA usage consumed by a fleet. Moving forward you should see accurate OTA usage data in the console, though metrics may lag actual consumption by a brief period (~ 1 minute).
Thank you again for voicing your concerns and contributing to an improved experience on the platform. Please do not hesitate to reach out if you encounter any unexpected behavior in the future.