System suddenly sends 20logs/second and consumes 2.1GB of data

I have a system running the latest software SDK 0.11.1 that was connected and running for several days before suddenly started sending continuous “net_sock invalid access on sock 0 by thread 0x20025508” error logs at about 20 logs/second. It ran more than a day before our cellular provider notified us of the excessive usage and we turned off cellular to that device. Looking at the Golioth logs all 25 pages of logs contain 12 seconds of these logs.

The Golioth usage panel doesn’t even graph this level of usage and cuts off the test in both Chrome and Edge at any zoom level.

But my celluar provider clearly shows the usage spike. Days before the spike doen’t even get one dot on the graph.

This is not an error that I have seen so I haven’t filtered it but it is extremely concerning that a system would spontaneously start generating this level of traffic. I can’t deploy 10’s of systems much less hundreds or thousands if they are going to do this.

This is now the third ‘excessive data’ issue I’ve experienced. The other two are:

@john.stuewe thank you for your detailed report. We will take a look at the error reported by your logging and follow up.

To clarify, are you reporting that 12 seconds of these logs are shown, then none of the subsequent logs over the 1+ day period were shown? If so, this likely explains the discrepancy in your Golioth data usage and cellular usage (i.e. data was being sent over the cellular network, but being rejected by Golioth due to rate limiting).

Thank you for this feedback. The reported usage displayed reflects processed logs, which would align with your report of only the initial logs being recorded. When you say that the panel “cuts off the test”, are you referring to the Golioth usage not matching your cellular usage or another issue?

No. I’m saying that the Golioth web interface only allows viewing 25 pages of 10 logs which is the most recent 250 logs. Golioth is not rate limiting and 250 of these logs are were replaced and overwritten every 12 seconds which used 2GB of data before we noticed and turned off cellular to that remote device.

Here is an example of just over 1 seconds of logs

goliothctl logs --device $mydevid --interval 48h | head -n 35
[2024-04-07T03:03:16Z] level:ERROR  module:"net_sock"  message:"invalid access on sock 0 by thread 0x20025508"  device_id:"653d82f60d554b853f932d66" metadata:"{}"
[2024-04-07T03:03:16Z] level:ERROR  module:"net_sock"  message:"invalid access on sock 0 by thread 0x20025508"  device_id:"653d82f60d554b853f932d66" metadata:"{}"
[2024-04-07T03:03:16Z] level:ERROR  module:"net_sock"  message:"invalid access on sock 0 by thread 0x20025508"  device_id:"653d82f60d554b853f932d66" metadata:"{}"
[2024-04-07T03:03:16Z] level:ERROR  module:"net_sock"  message:"invalid access on sock 0 by thread 0x20025508"  device_id:"653d82f60d554b853f932d66" metadata:"{}"
[2024-04-07T03:03:16Z] level:ERROR  module:"net_sock"  message:"invalid access on sock 0 by thread 0x20025508"  device_id:"653d82f60d554b853f932d66" metadata:"{}"
[2024-04-07T03:03:16Z] level:ERROR  module:"net_sock"  message:"invalid access on sock 0 by thread 0x20025508"  device_id:"653d82f60d554b853f932d66" metadata:"{}"
[2024-04-07T03:03:16Z] level:ERROR  module:"net_sock"  message:"invalid access on sock 0 by thread 0x20025508"  device_id:"653d82f60d554b853f932d66" metadata:"{}"
[2024-04-07T03:03:17Z] level:ERROR  module:"net_sock"  message:"invalid access on sock 0 by thread 0x20025508"  device_id:"653d82f60d554b853f932d66" metadata:"{}"
[2024-04-07T03:03:17Z] level:ERROR  module:"net_sock"  message:"invalid access on sock 0 by thread 0x20025508"  device_id:"653d82f60d554b853f932d66" metadata:"{}"
[2024-04-07T03:03:17Z] level:ERROR  module:"net_sock"  message:"invalid access on sock 0 by thread 0x20025508"  device_id:"653d82f60d554b853f932d66" metadata:"{}"
[2024-04-07T03:03:17Z] level:ERROR  module:"net_sock"  message:"invalid access on sock 0 by thread 0x20025508"  device_id:"653d82f60d554b853f932d66" metadata:"{}"
[2024-04-07T03:03:17Z] level:ERROR  module:"net_sock"  message:"invalid access on sock 0 by thread 0x20025508"  device_id:"653d82f60d554b853f932d66" metadata:"{}"
[2024-04-07T03:03:17Z] level:ERROR  module:"net_sock"  message:"invalid access on sock 0 by thread 0x20025508"  device_id:"653d82f60d554b853f932d66" metadata:"{}"
[2024-04-07T03:03:17Z] level:ERROR  module:"net_sock"  message:"invalid access on sock 0 by thread 0x20025508"  device_id:"653d82f60d554b853f932d66" metadata:"{}"
[2024-04-07T03:03:17Z] level:ERROR  module:"net_sock"  message:"invalid access on sock 0 by thread 0x20025508"  device_id:"653d82f60d554b853f932d66" metadata:"{}"
[2024-04-07T03:03:17Z] level:ERROR  module:"net_sock"  message:"invalid access on sock 0 by thread 0x20025508"  device_id:"653d82f60d554b853f932d66" metadata:"{}"
[2024-04-07T03:03:17Z] level:ERROR  module:"net_sock"  message:"invalid access on sock 0 by thread 0x20025508"  device_id:"653d82f60d554b853f932d66" metadata:"{}"
[2024-04-07T03:03:17Z] level:ERROR  module:"net_sock"  message:"invalid access on sock 0 by thread 0x20025508"  device_id:"653d82f60d554b853f932d66" metadata:"{}"
[2024-04-07T03:03:17Z] level:ERROR  module:"net_sock"  message:"invalid access on sock 0 by thread 0x20025508"  device_id:"653d82f60d554b853f932d66" metadata:"{}"
[2024-04-07T03:03:17Z] level:ERROR  module:"net_sock"  message:"invalid access on sock 0 by thread 0x20025508"  device_id:"653d82f60d554b853f932d66" metadata:"{}"
[2024-04-07T03:03:17Z] level:ERROR  module:"net_sock"  message:"invalid access on sock 0 by thread 0x20025508"  device_id:"653d82f60d554b853f932d66" metadata:"{}"
[2024-04-07T03:03:17Z] level:ERROR  module:"net_sock"  message:"invalid access on sock 0 by thread 0x20025508"  device_id:"653d82f60d554b853f932d66" metadata:"{}"
[2024-04-07T03:03:17Z] level:ERROR  module:"net_sock"  message:"invalid access on sock 0 by thread 0x20025508"  device_id:"653d82f60d554b853f932d66" metadata:"{}"
[2024-04-07T03:03:17Z] level:ERROR  module:"net_sock"  message:"invalid access on sock 0 by thread 0x20025508"  device_id:"653d82f60d554b853f932d66" metadata:"{}"
[2024-04-07T03:03:17Z] level:ERROR  module:"net_sock"  message:"invalid access on sock 0 by thread 0x20025508"  device_id:"653d82f60d554b853f932d66" metadata:"{}"
[2024-04-07T03:03:17Z] level:ERROR  module:"net_sock"  message:"invalid access on sock 0 by thread 0x20025508"  device_id:"653d82f60d554b853f932d66" metadata:"{}"
[2024-04-07T03:03:17Z] level:ERROR  module:"net_sock"  message:"invalid access on sock 0 by thread 0x20025508"  device_id:"653d82f60d554b853f932d66" metadata:"{}"
[2024-04-07T03:03:17Z] level:ERROR  module:"net_sock"  message:"invalid access on sock 0 by thread 0x20025508"  device_id:"653d82f60d554b853f932d66" metadata:"{}"
[2024-04-07T03:03:17Z] level:ERROR  module:"net_sock"  message:"invalid access on sock 0 by thread 0x20025508"  device_id:"653d82f60d554b853f932d66" metadata:"{}"
[2024-04-07T03:03:17Z] level:ERROR  module:"net_sock"  message:"invalid access on sock 0 by thread 0x20025508"  device_id:"653d82f60d554b853f932d66" metadata:"{}"
[2024-04-07T03:03:17Z] level:ERROR  module:"net_sock"  message:"invalid access on sock 0 by thread 0x20025508"  device_id:"653d82f60d554b853f932d66" metadata:"{}"
[2024-04-07T03:03:17Z] level:ERROR  module:"net_sock"  message:"invalid access on sock 0 by thread 0x20025508"  device_id:"653d82f60d554b853f932d66" metadata:"{}"
[2024-04-07T03:03:17Z] level:ERROR  module:"net_sock"  message:"invalid access on sock 0 by thread 0x20025508"  device_id:"653d82f60d554b853f932d66" metadata:"{}"
[2024-04-07T03:03:18Z] level:ERROR  module:"net_sock"  message:"invalid access on sock 0 by thread 0x20025508"  device_id:"653d82f60d554b853f932d66" metadata:"{}"
[2024-04-07T03:03:18Z] level:ERROR  module:"net_sock"  message:"invalid access on sock 0 by thread 0x20025508"  device_id:"653d82f60d554b853f932d66" metadata:"{}"```

I’m not sure how much data Golioth is consuming because the scale on the left side of the graphic is cut off. There are too many digits to display which can’t be a good thing. (See picture above.)

If it was rate limiting it would limit the cellular data but it would still consume a lot. I turned off any logs I saw using data but I never saw this one in development so it wasn’t turned off. If any module in Zephyr or Golioth can do this then it’s not safe to go to sleep with a system running and it isn’t safe to leave the Golioth logging system enabled in production which defeats the whole purpose of having logging in the first place.

Thank you for this clarification.

Thank you for this feedback. We will ensure to fix the scaling of the chart such that the quantity on the y-axis is not truncated. In the meantime, as evidenced by your screenshot, you can see the exact usage by hovering / clicking on the bar(s) for the date in question. For example, I can see that your usage on April 6th was 330,512 KB of logs (device_logs) and 230 KB of Light DB Stream (data_lightdb_stream), putting your cumulative usage over 300,000 KB (300 MB), which is the top tick on the y-axis (with each tick representing 50,000 KB). We will also update the usage chart to ensure that the top y-axis tick represents the “next” increment above your peak usage to make this more clear.

If the logs were the only data being sent to Golioth (or the vast majority of the data), you may have been falling just under rate limiting at 20 req/s. There is additional data that is transmitted over your cellular network when establishing a connection with Golioth and delivering logs, but in the case of logs, usage is only recorded for the payload content. This, along with data that is not counted against Golioth usage (i.e. device management operations), could leading to the difference between your Golioth usage (~0.33 GB) and cellular network usage (2.1 GB).

Regarding the error you are seeing in the logs, this looks similar to SDK 0.10.0 sends >15million logs/day in error condition, though the frequency of invalid access on sock 0 logs is much higher and there are no logs referencing the unknown CoAP response, which was an indicator of experiencing rate limiting. You mentioned that you are using SDK v0.11.1, which should have the relevant bug fix. However, I am curious if your logging configuration between SDK 0.10.0 sends >15million logs/day in error condition and this ticket has changed, as the logs representing rate limiting could be getting filtered out now. Would you mind sharing your logging configuration?

Here is the routine I use to set logging levels. I have a global Dbug level I set depending on what level of debug I want to see. I know it isn’t code efficient but that hasn’t been a problem yet.

void sync_logging_level()
{
   // configure default log levels to turn off the chatty logs
   log_filter_set(NULL, 0, log_source_id_get("mcuboot"),      LOG_LEVEL_DBG);
   log_filter_set(NULL, 0, log_source_id_get("mcuboot_util"), LOG_LEVEL_DBG);
   log_filter_set(NULL, 0, log_source_id_get("sm_iot"),       LOG_LEVEL_DBG);
   log_filter_set(NULL, 0, log_source_id_get("battery"),      LOG_LEVEL_DBG);
   log_filter_set(NULL, 0, log_source_id_get("golioth"),      LOG_LEVEL_DBG);
   log_filter_set(NULL, 0, log_source_id_get("golioth_system"), LOG_LEVEL_DBG);
   log_filter_set(NULL, 0, log_source_id_get("sensor_if"),    LOG_LEVEL_DBG);
   log_filter_set(NULL, 0, log_source_id_get("app_state"),    LOG_LEVEL_DBG);
   log_filter_set(NULL, 0, log_source_id_get("app_settings"), LOG_LEVEL_INF);
   log_filter_set(NULL, 0, log_source_id_get("app_shell"),    LOG_LEVEL_DBG);

   if(Dbug > 110) {
      LOG_PANIC();
   }
   if(Dbug < 50) {
      log_filter_set(NULL, 0, log_source_id_get("app_state"),     LOG_LEVEL_INF);
      log_filter_set(NULL, 0, log_source_id_get("battery"),       LOG_LEVEL_INF);
      log_filter_set(NULL, 0, log_source_id_get("golioth_system"), LOG_LEVEL_WRN);
      log_filter_set(NULL, 0, log_source_id_get("golioth_mbox"),  LOG_LEVEL_WRN);
      log_filter_set(NULL, 0, log_source_id_get("golioth_fw_update"),  LOG_LEVEL_WRN);
      log_filter_set(NULL, 0, log_source_id_get("golioth_coap_client"), LOG_LEVEL_WRN);
      log_filter_set(NULL, 0, log_source_id_get("fw_block_processor"), LOG_LEVEL_WRN);
      log_filter_set(NULL, 0, log_source_id_get("golioth_coap_client_zephyr"), LOG_LEVEL_WRN);
//xx      log_filter_set(NULL, 0, log_source_id_get("i2c_nrfx_twim"), LOG_LEVEL_NONE);
   }
   if(Dbug < 25) {
      log_filter_set(NULL, 0, log_source_id_get("golioth"),      LOG_LEVEL_INF);
      if(loopcount > 3) {
         log_filter_set(NULL, 0, log_source_id_get("golioth_fw_update"),   LOG_LEVEL_WRN);
      }
      log_filter_set(NULL, 0, log_source_id_get("app_state"),    LOG_LEVEL_WRN);
      log_filter_set(NULL, 0, log_source_id_get("ds28e18"), LOG_LEVEL_NONE);
      log_filter_set(NULL, 0, log_source_id_get("BMP5xx"), LOG_LEVEL_NONE);
      log_filter_set(NULL, 0, log_source_id_get("mcuboot_util"), LOG_LEVEL_ERR);
      log_filter_set(NULL, 0, log_source_id_get("golioth_coap_client"),  LOG_LEVEL_ERR);
      log_filter_set(NULL, 0, log_source_id_get("golioth_coap_client_zephyr"), LOG_LEVEL_NONE);
      log_filter_set(NULL, 0, log_source_id_get("golioth_sys_zephyr"), LOG_LEVEL_NONE);
   }
   if(Dbug < 10) {
      log_filter_set(NULL, 0, log_source_id_get("golioth"),      LOG_LEVEL_ERR);
      log_filter_set(NULL, 0, log_source_id_get("golioth_fw_update"), LOG_LEVEL_WRN);
      log_filter_set(NULL, 0, log_source_id_get("net_sock"), LOG_LEVEL_NONE);
   }
   if(Dbug > 40) {
      log_printk_enable(false); // do not send logs to Golioth when debug level is too high.
   }
   else {
      log_printk_enable(true);
   }
   if(Dbug > 60) LOG_INF("log levels synched to debug level.");
   return;
}

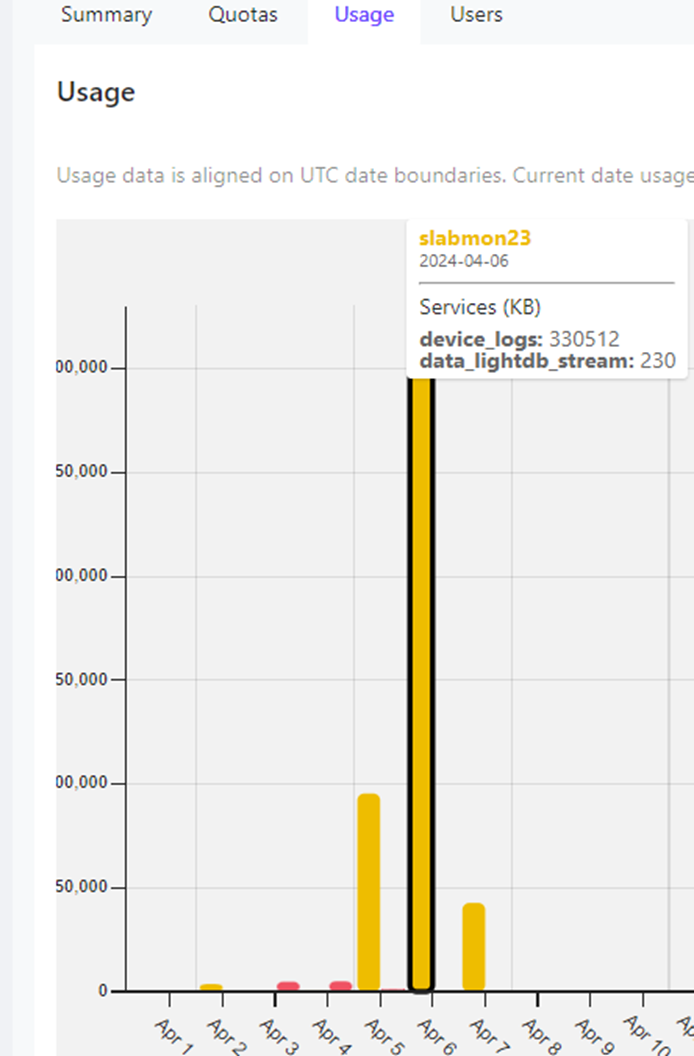
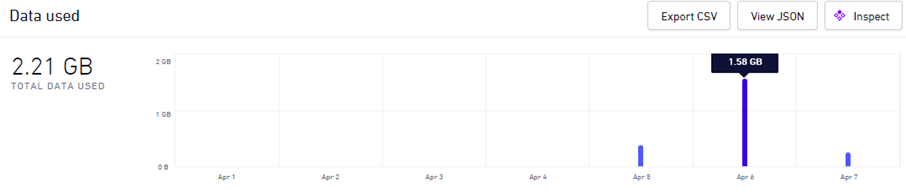
So even with rate limiting this system would generate 0.33GB/day * 30 days * 0.20/MB($200?GB) = $1980 in data charges to Golioth PER DEVICE (Plus cellular charges).
This is a HUGE exposure to someone with a fleet of device that could start accruing this kind pf expense without notice. If there is no way to prevent this in the API then Golioth needs to have all kinds of warnings and BLOG entries on how to mitigate it.

@john.stuewe thank you for sharing this additional information. We are working to reproduce the exact behavior you are experiencing here, and I will make sure to follow up with our findings.

We are also working on instituting user-defined usage limits and notifications, which will be able to be configured at an organization level in the console. We should be able to provide more information on this functionality soon.

Hi John,

We’ve been troubleshooting the socket error and one thing that popped to mind was this part of your original report:

This is not an error that I have seen so I haven’t filtered it

I wonder if it would be a good approach to programmatically set all logging sources to NONE so that you don’t receive log messages by surprise? It is possible to do this at the start of main() and then update your sync_logging_level() function to serve as an allow-list (turning logging sources on as you need them).

#include <zephyr/logging/log_ctrl.h>

void set_all_log_levels(uint32_t log_level)
{
  int source_id = 0;
  char *source_name;

  while (1) {
    source_name = (char *)log_source_name_get(0, source_id);
    if ((source_name == NULL) || (source_id < 0))
    {
      break;
    }

    log_filter_set(NULL, 0, source_id, log_level);
    ++source_id;
  }
}

/* in main() call this: */
int main(void)
{
  set_all_log_levels(LOG_LEVEL_NONE);
}

yes. I had the same though and have been running test code that disables everything. It’s a workaround though since, even in production, we want to know when critical errors occur. We just can’t risk seeing log floods like this so I’ll likely have to disable by default and loose any field error reporting… which is the purpose of the logging system!!

Note that setting log levels before all the log backends are active won’t work because they will activate at their default level after you tried to disable them. I saw this and reported it in Log filtering not working for one module.
I’m calling it from the Golioth on_connect function now.